Industrial metal · Cu · priced per pound
Copper price history
The bulk of every pre-1982 cent and the other tenth of a 90% silver coin.
Copper spot
$6.07 /lb
Live spot · Metals.dev
- Change · 60Y
- up +1,237%
- High
- $6.59 Jan 29, 2026
- Low
- $0.416 Oct 1972
Ringed points are verified record highs and lows on their exact dates; averages alone would flatten them. 30D fill in as prices are stored each day.
Monthly averages in nominal U.S. dollars per pound, not adjusted for inflation (published per metric ton; shown per pound). Source: World Bank Commodity Price Data (The Pink Sheet) (CC BY 4.0). Daily closes and the live price, where shown, are from Metals.dev.
Copper since 1965
- Highest monthly average
- $6.58 /lb · Oct 2026
- Lowest monthly average
- $0.416 /lb · Oct 1972
- Jan 1965 to Oct 2026
- $0.454 to $6.58 · 14×
Record highs and lows
Monthly averages smooth out one-day spikes, so these verified figures are plotted on their exact dates as well. Each names what was measured; where sources differ, the note says so.
- Jan 29, 2026$6.59 /lbRecord LME three-month high (January 2026). Higher records in September 2026 were reported between $14,533 and $14,779; they are not confirmed against one source. Creamer Media (Reuters), 29 January 2026 · Engineering News, 8 September 2026Published as $14,527 per metric ton.
- May 20, 2024$5.04 /lbRecord LME three-month high (2024). Reuters via Kitco, 20 May 2024 · Mining.comPublished as $11,105 per metric ton.
- Feb 15, 2011$4.62 /lbRecord LME three-month high (2011). Business Recorder (Reuters) · SMM (Bloomberg)Published as $10,190 per metric ton.
Annual average prices, 1965–2026
- 1965$0.586
- 1966$0.695
- 1967$0.515
- 1968$0.563
- 1969$0.666
- 1970$0.642
- 1971$0.490
- 1972$0.480
- 1973$0.810
- 1974$0.934
- 1975$0.560
- 1976$0.635
- 1977$0.594
- 1978$0.619
- 1979$0.900
- 1980$0.990
- 1981$0.790
- 1982$0.672
- 1983$0.722
- 1984$0.625
- 1985$0.643
- 1986$0.623
- 1987$0.809
- 1988$1.18
- 1989$1.29
- 1990$1.21
- 1991$1.06
- 1992$1.03
- 1993$0.868
- 1994$1.05
- 1995$1.33
- 1996$1.04
- 1997$1.03
- 1998$0.750
- 1999$0.713
- 2000$0.823
- 2001$0.716
- 2002$0.707
- 2003$0.807
- 2004$1.30
- 2005$1.67
- 2006$3.05
- 2007$3.23
- 2008$3.16
- 2009$2.34
- 2010$3.42
- 2011$4.00
- 2012$3.61
- 2013$3.33
- 2014$3.11
- 2015$2.50
- 2016$2.21
- 2017$2.80
- 2018$2.96
- 2019$2.73
- 2020$2.80
- 2021$4.23
- 2022$4.00
- 2023$3.85
- 2024$4.15
- 2025$4.51
- 2026 · 10 mo$6.14
Each year is the average of its monthly averages; 2026 covers its first 10 months.
Coins that contain copper
See them in the value chart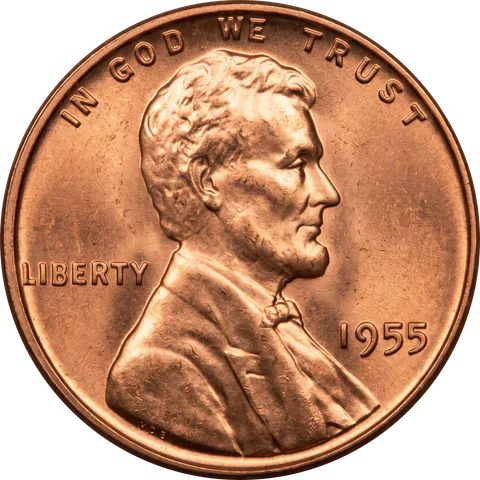
Lincoln Wheat Cent
1909–19582.95 g Cu
$0.03954.0× face value
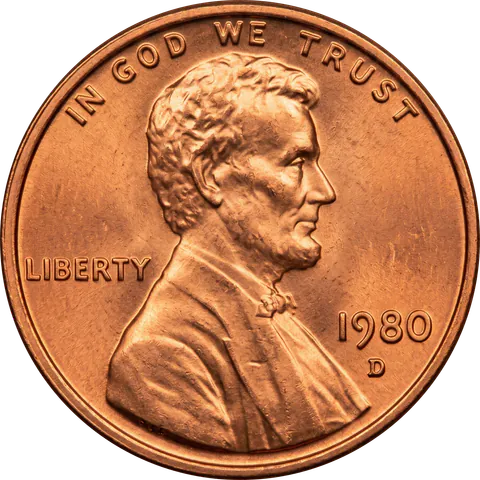
Lincoln Memorial Cent
1959–19822.95 g Cu
$0.03954.0× face value

Roosevelt Dime (Clad)
1965–present2.27 g Cu-Ni
$0.03080.31× face value

Washington Quarter (Clad)
1965–present5.67 g Cu-Ni
$0.07700.31× face value